GIS Work 2021
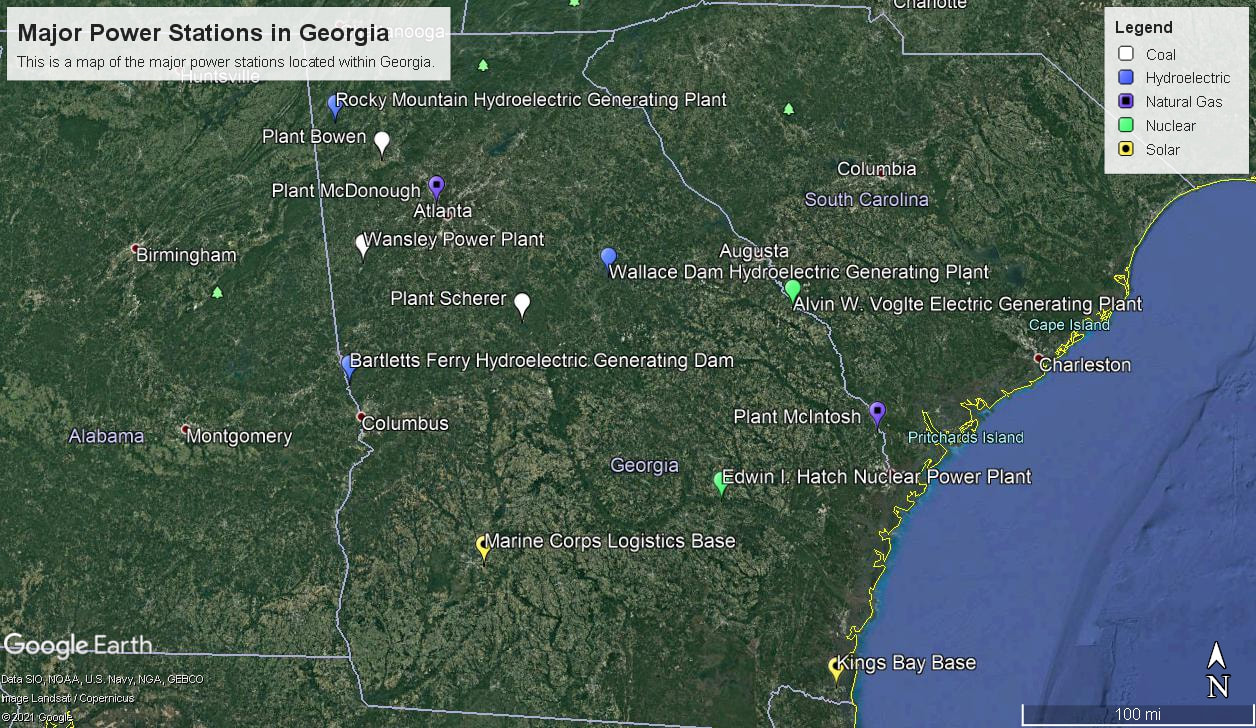
This map showcases the power stations in Georgia with the highest energy output by kilowatts, and their type. The types include, but are not limited to hydroelectric dams and nuclear plants.
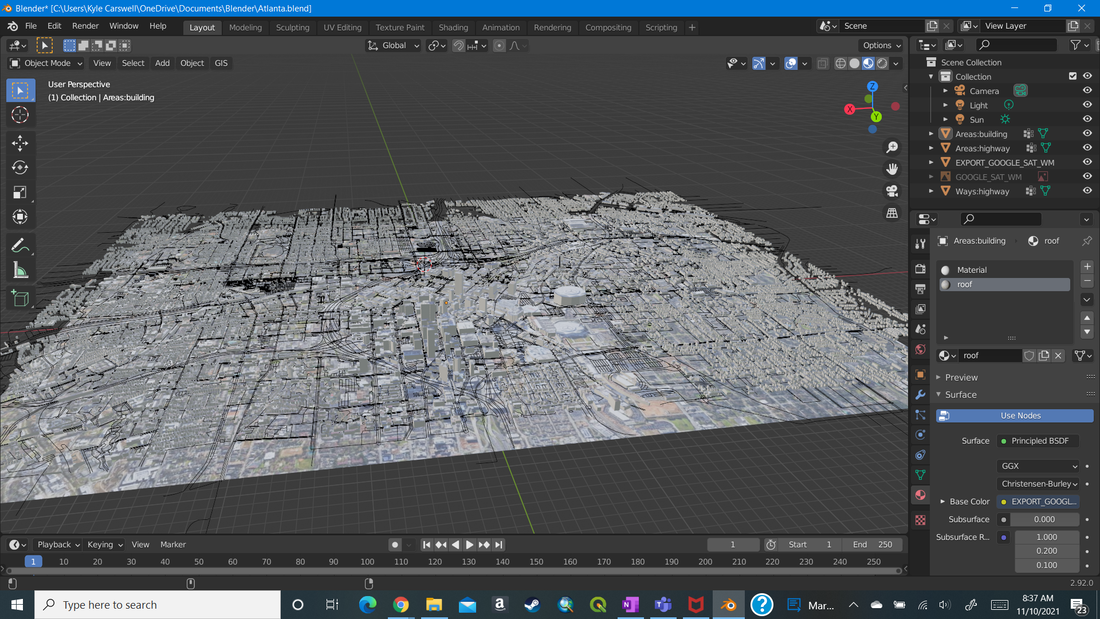
This is a Blender file that showcases a 3D remake of Atlanta. I created this in Blender GIS, an addon to Blender that allows the user to make 3D maps in GIS. To view this, your computer will need both Blender and the Blender GIS addon.
| atlanta.blend1 |
Ventusky is a website that can showcase free Weather maps with live updates on factors such as wind speed, precipitation, cloud cover, and humidity. I chose to display my hometown of Lawrenceville, and the surrounding Metro Atlanta area, and the perceived temperature of the area.

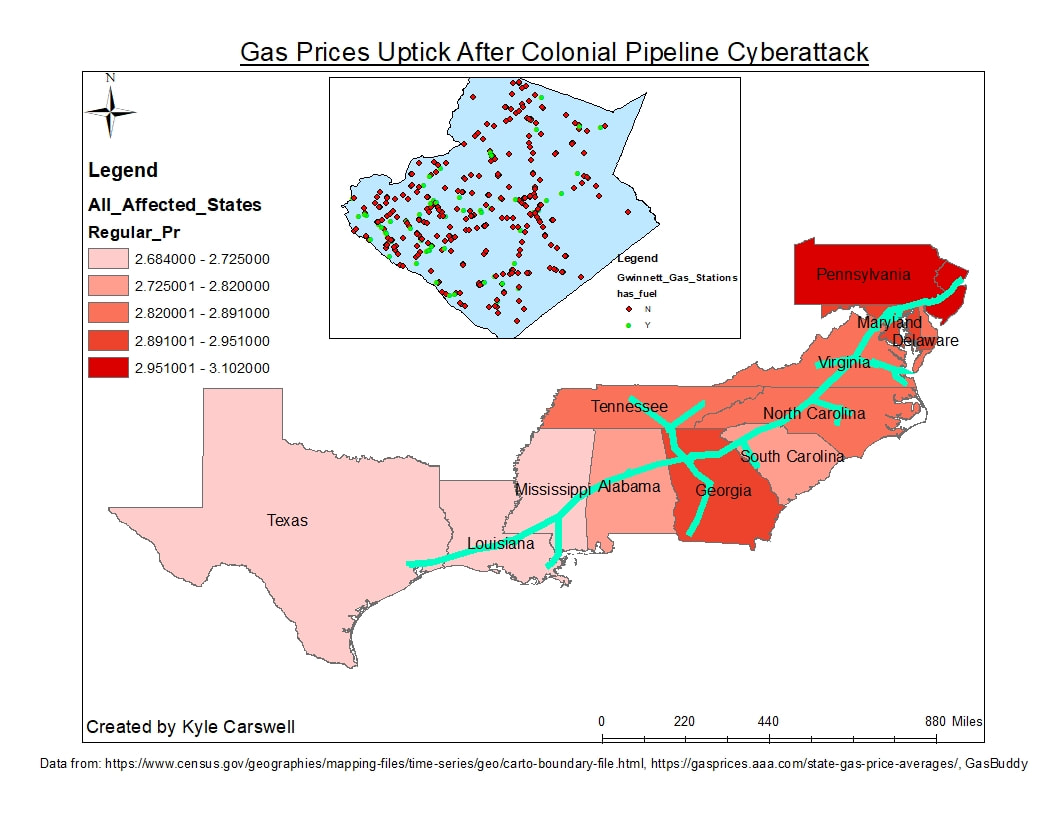
This is an ArcMap map detailing the rise of Gasoline Prices across the Southeastern United States after the Colonial Pipeline Cyberattack. The main map shows the trend of gas prices for regular, unleaded gasoline, with a deeper red meaning higher prices. The hardest hit states, as one can tell, were Pennsylvania, Maryland, Delaware, and Georgia. The inset map is about Gwinnett County, Georgia, and it has a map of all Gas stations throughout the county, as well as whether or not they had gas at the time this map was created.
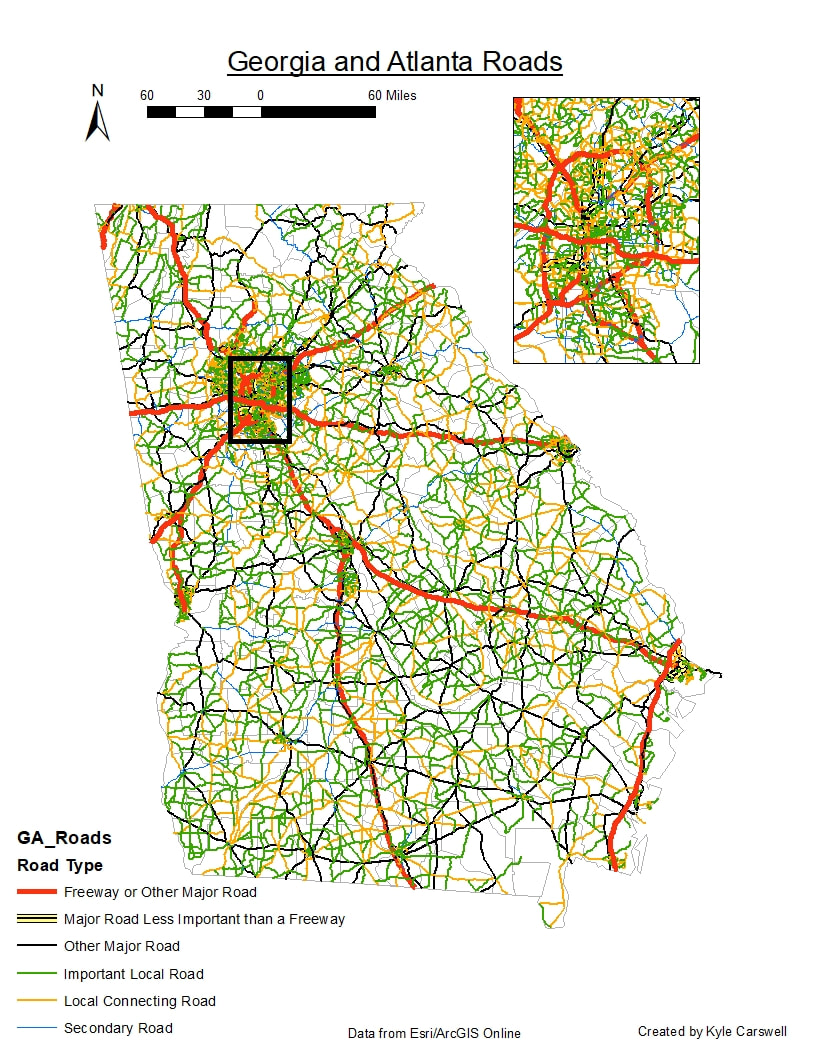
This is a map I made of Georgia's road system, with differing symbology based on the type of road (freeways, local connecting roads, etc.), as well as an inset map showing the roads of Atlanta and the surrounding area in greater detail.
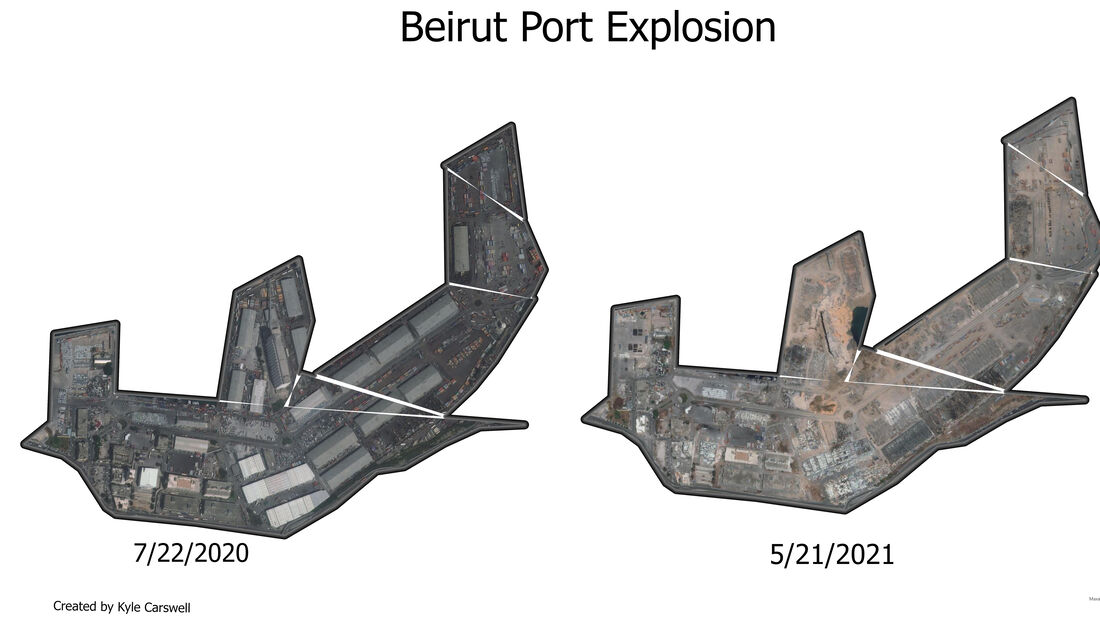
This is an ArcGIS Pro map showcasing the Port of Beirut before and after the August 4, 2020 explosion. I used the Create Polygons feature and the Esri Global Background imagery to create the two images of Beirut's port.
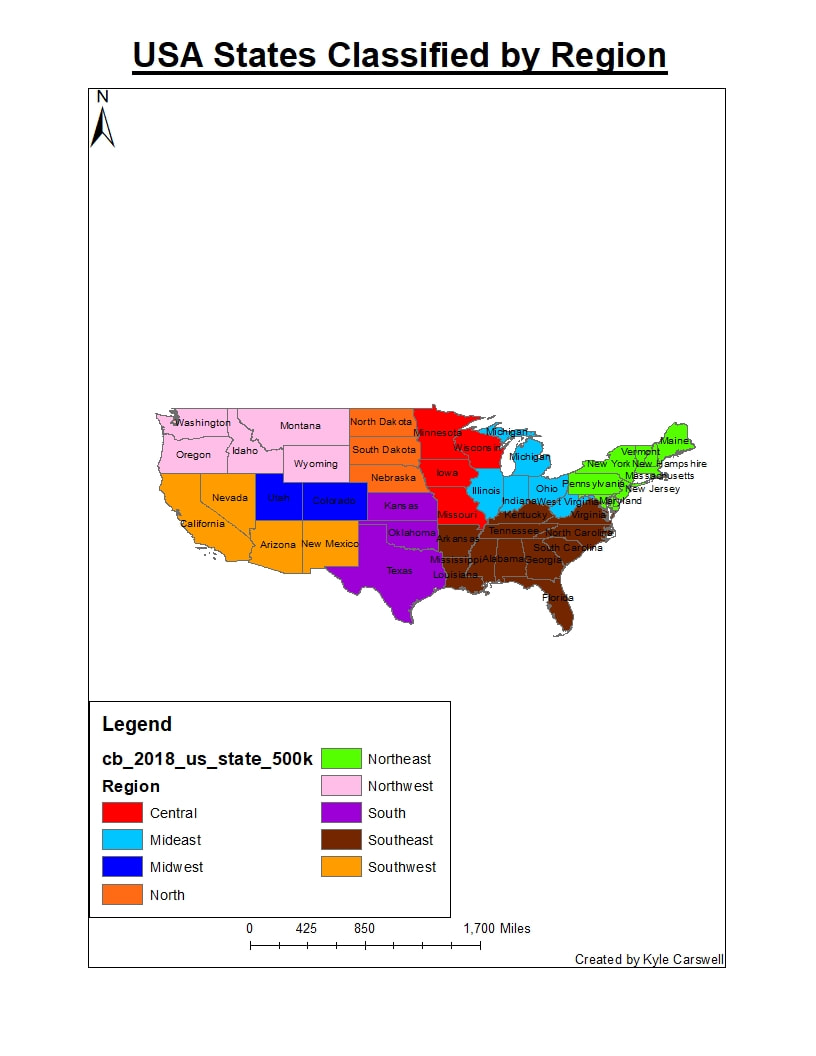
This map combines my skills in ArcMap with Access databases. I created a table of the 50 states of the USA, as well as classifying them based on size and the region they were located in via Microsoft Access's SQL statements. I then established an OLE Database Connection in ArcCatalog with the database, then joined the data to an existing USA states shapefile that I had downloaded.
| usa_data.accdb |
This is a map I created in the US Census's OnTheMap application to analyze job outlooks, earnings, industry sector, and worker education, among others. The data is displayed in both a map, as well as the option of bar charts or pie charts. Attached is the link to the map I created. Use this link https://onthemap.ces.census.gov/ to view the map.
| settings_2021_10_20_13_16_16.otm |
This is a 3D map of Atlanta I created using the Blender 3D software, as well as its GIS plugin/extension. Using this extension, I mapped out Atlanta, getting the layout of the city via Google Satellite Maps, and then extruding the results to get the buildings in 3D.
This is a map I created in ArcGIS Online that illustrates the biking pathways in the city and dividing them by type (Off-Road, Bike Lane, etc.), as well as the clustering of streetlights throughout the city. The purpose of this map is to showcase where bike riders can legally and safely go, especially at night. The paths showcase where bikes are permitted, and the less streetlights there are, the less safe the area may be.
This is a map made in Google MyMaps as a list of possible tourist spots in Atlanta that one might want to visit on vacation. The list is split into various types, such as parks, museums, sporting venues, and restaurants.